Monitoring
This guide explains how the Stellar Disbursement Platform (SDP) exposes runtime metrics and how to hook those metrics into the Prometheus + Grafana stack.
Metrics Endpoints
Both the Dashboard API and the Transaction Submission Service (TSS) expose Prometheus-compatible /metrics endpoints. The HTTP server is defined in serve_metrics.go and is controlled through the following environment variables:
METRICS_PORT– Port used by the Dashboard API metrics server (defaults to 8002).METRICS_TYPE– Monitoring backend in use (currentlyPROMETHEUS).TSS_METRICS_PORT– Port used by the TSS metrics server (defaults to 9002).TSS_METRICS_TYPE– Monitoring backend for the TSS (defaults toTSS_PROMETHEUS).
When the server starts, it mounts the /metrics route and surfaces request, database, and TSS-specific counters and histograms that align with the Grafana dashboards provided in Grafana README.
Payment-related metrics carry a wallet_id label naming the distribution account the funds were sent from, so any panel can be broken down per account. Do not confuse it with the neighbouring wallet label, which names the recipient's wallet provider.
The Dashboard API and the TSS both export successful and failure database query durations, including percentiles (p50, p90, p95, p99). The TSS also exports HTTP request durations, and its transaction latency histogram extends to 30 minutes so slow submissions stay visible.
Shipping Logs
The SDP always writes structured logs to stdout, which is the recommended way to collect them. On Kubernetes, run a collector that reads the container's stdout.
For platforms where nothing can read stdout, such as a PaaS with no log drain, set LOG_SHIPPING_URL to a Loki-compatible push endpoint (for example, a Grafana Alloy loki.source.api receiver). The SDP then streams the same structured logs to that endpoint over HTTP, in addition to stdout. Log shipping is disabled when the variable is not set.
Transaction Submission Service log lines carry a wallet_id field identifying the distribution account that sent the payment, alongside a payment_id field that correlates them with the originating SDP payment. Together these let you filter transaction activity down to a single account, or trace one payment end to end. Both are structured fields inside the log line rather than Loki stream labels; the shipper keeps stream labels to service and level to avoid unbounded cardinality, so query them with a JSON or line filter.
Local Prometheus and Grafana Stack
We provide a Docker Compose file that boots Prometheus and Grafana pre-wired to scrape the SDP metrics endpoints.
- From the repository root, run:
cd dev
docker compose -p sdp-multi-tenant -f docker-compose-monitoring.yml up -d
This launches Prometheus on port 9090 and Grafana on port 3002 by default monitoring config.
- The Prometheus container loads its configuration from prometheus config, which targets
host.docker.internal:8002/metricsby default. Adjust thetargetslist if you run the API on a different host or if you want to scrape the TSS metrics (host.docker.internal:9002). - Grafana uses the datasource configuration in datasource, which points to the Prometheus instance above. If you have an existing Prometheus deployment, update this URL accordingly.
To tear down the monitoring stack, run:
cd dev
docker compose -p sdp-multi-tenant -f docker-compose-monitoring.yml down
Load the SDP Grafana Dashboard
-
Navigate to http://localhost:3002 and sign in with the default
admin/admincredentials.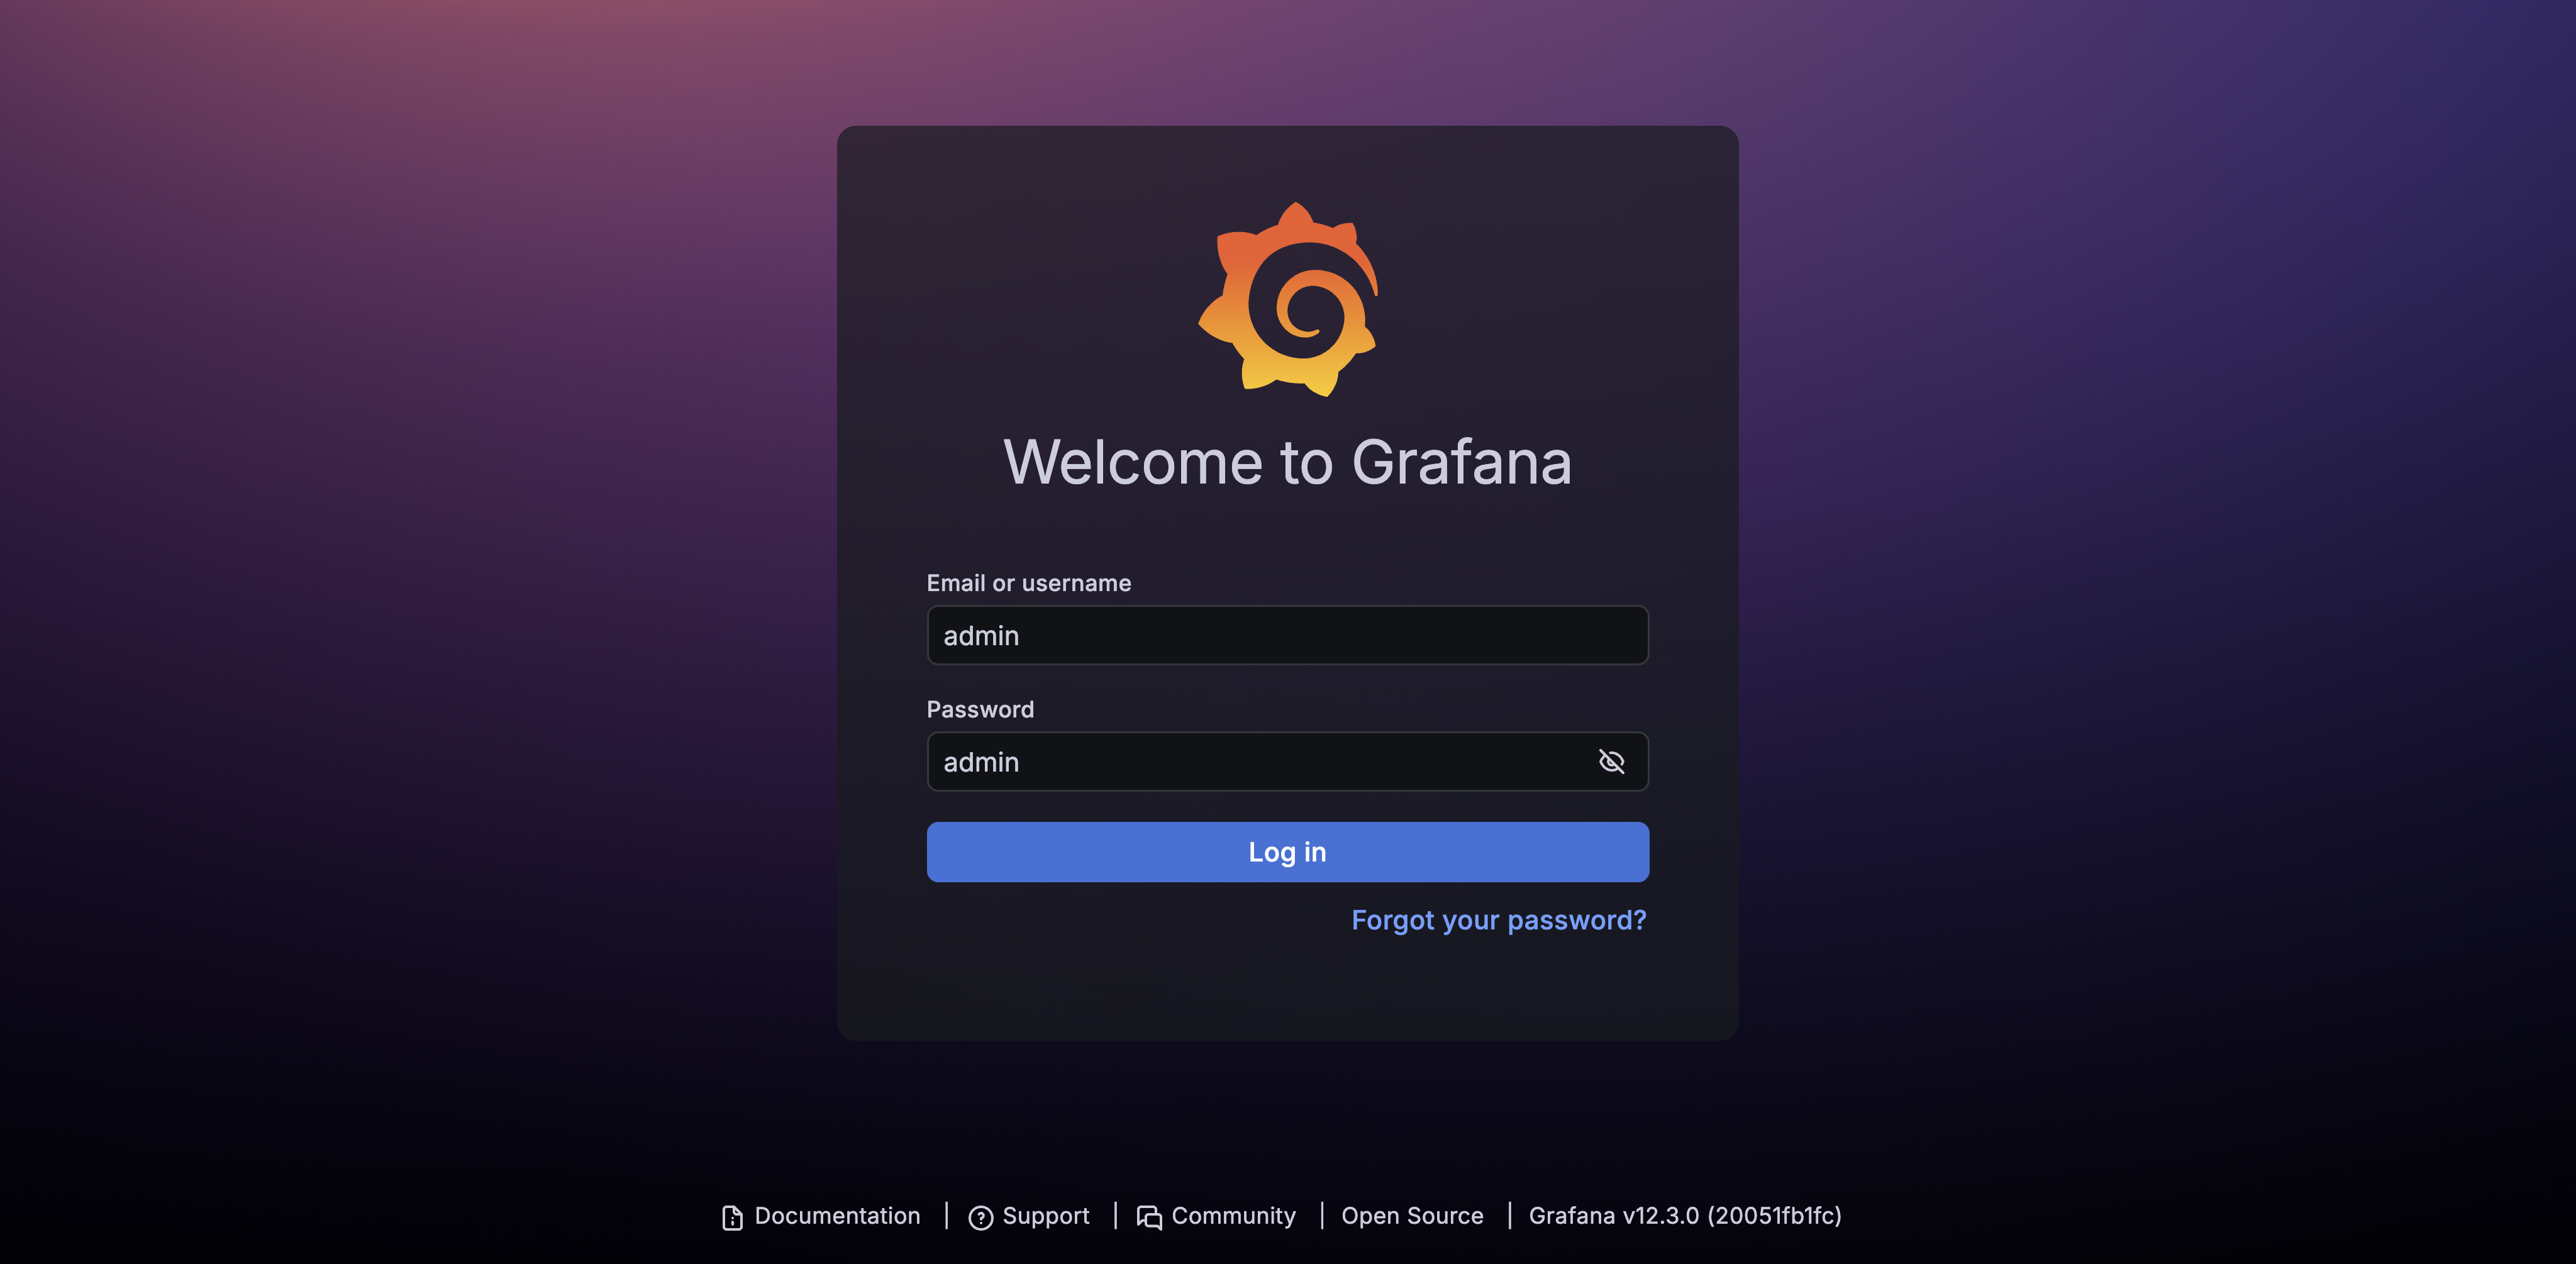
-
Click the
+icon in the top navigation bar (next to the search input), chooseImport dashboard, and paste the contents of Grafana Dashboard Json.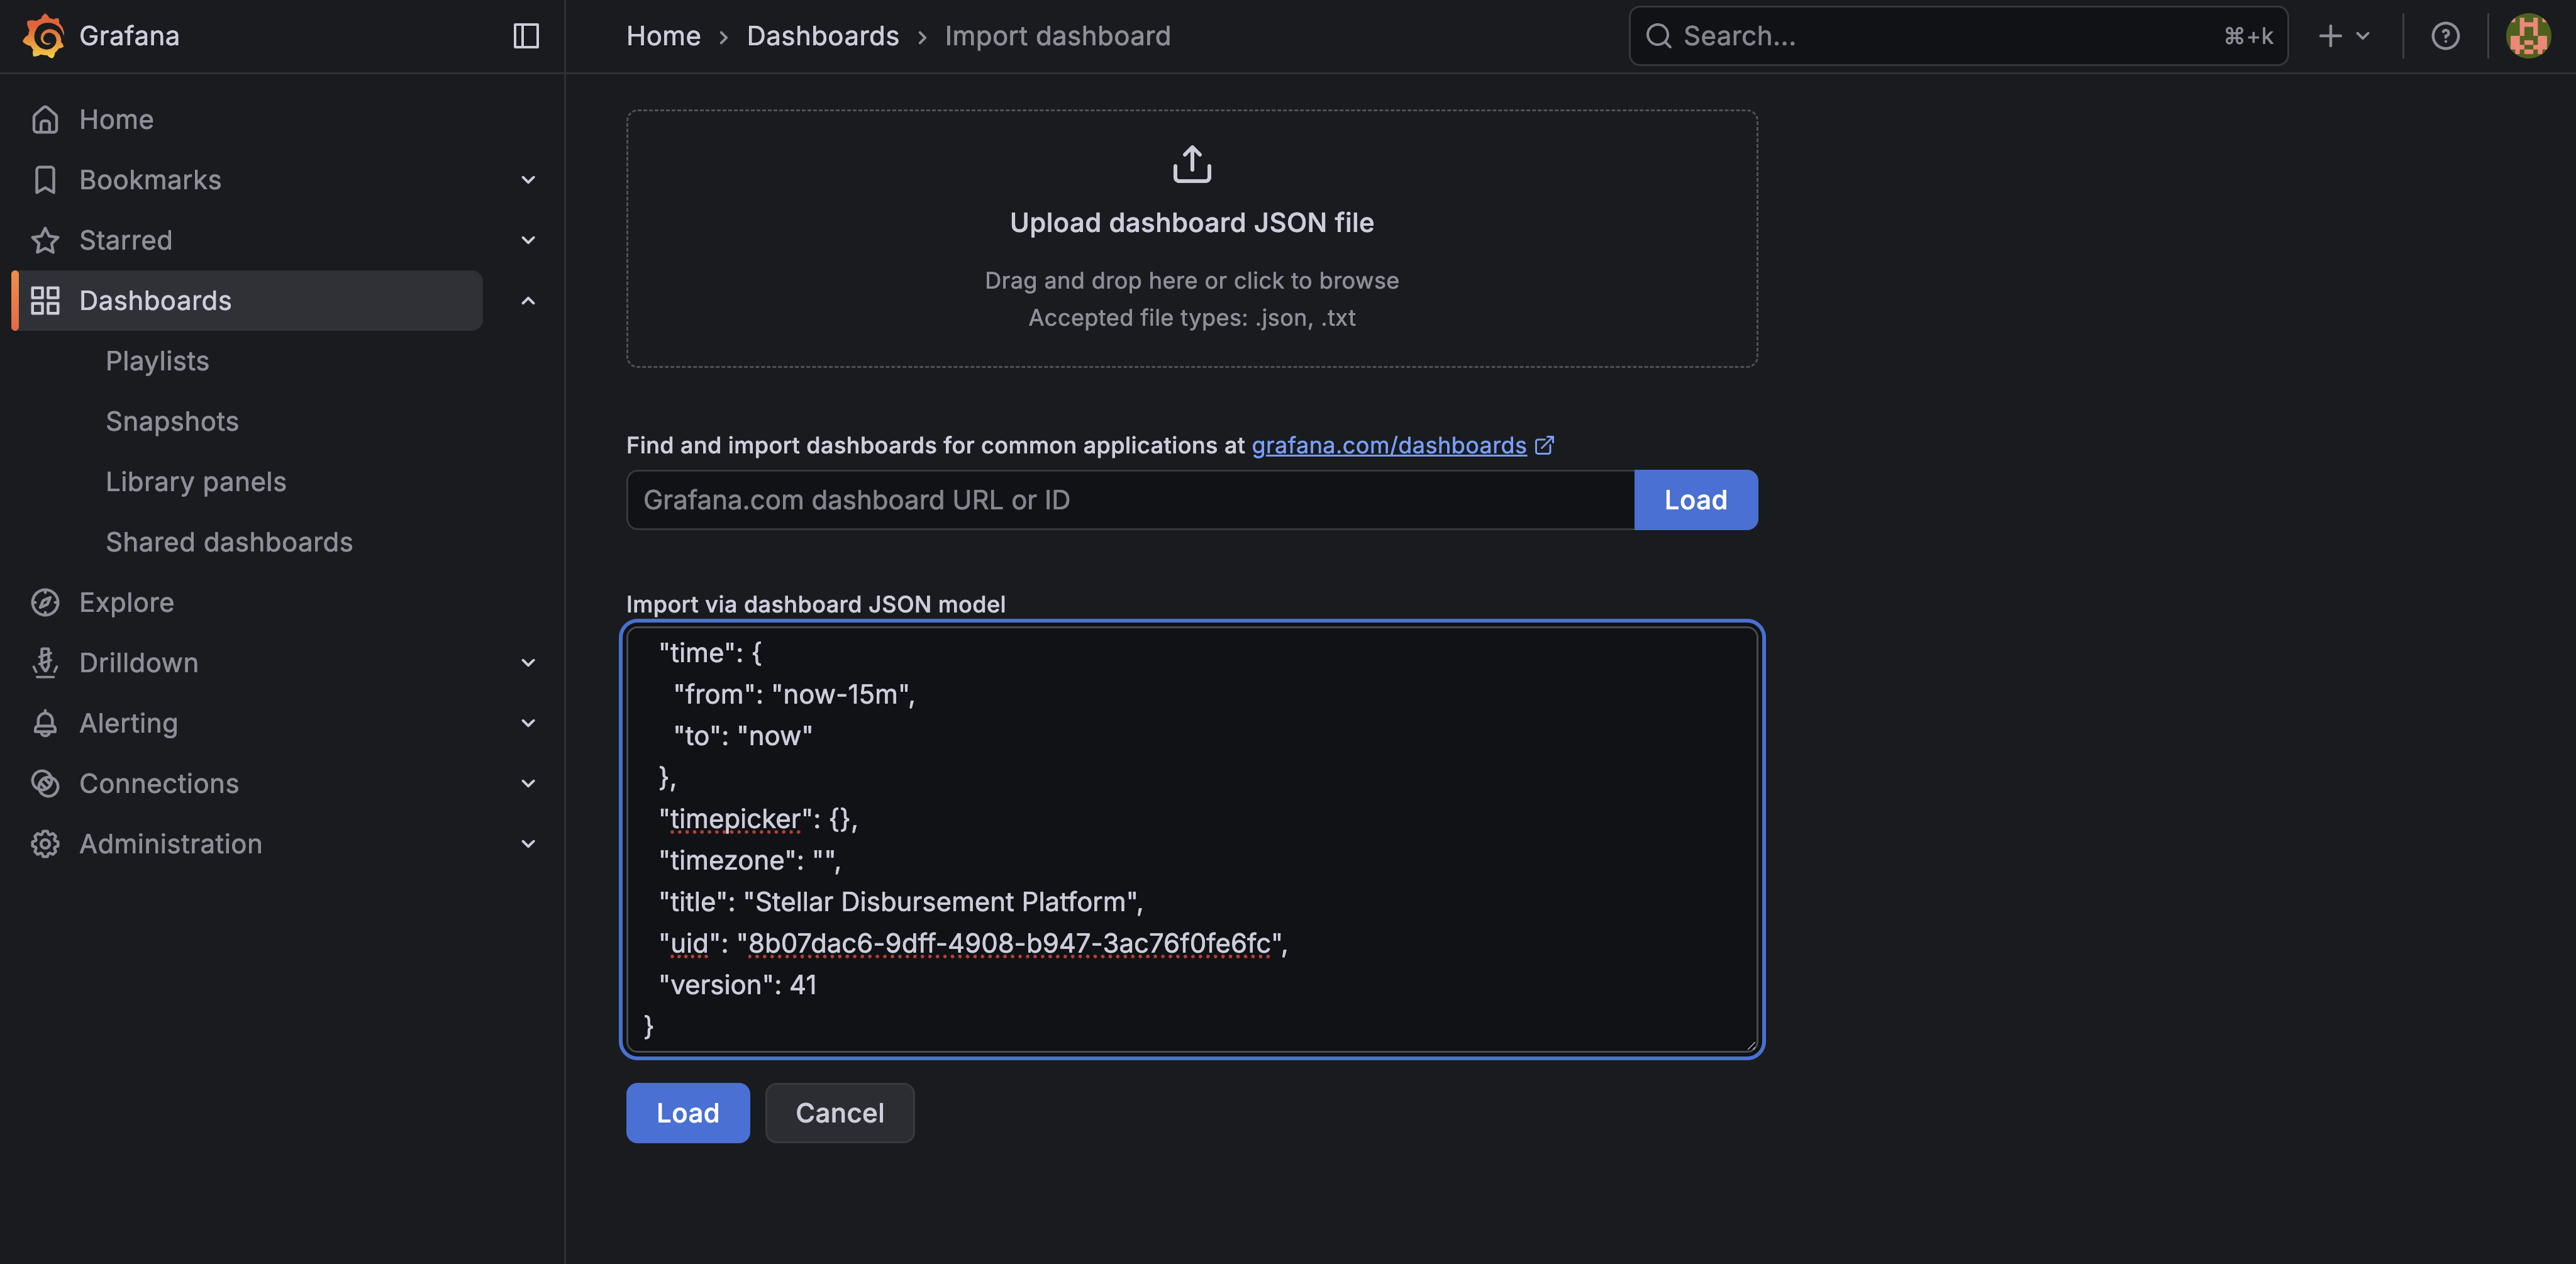
-
Select the
prometheusdatasource provided by datasource.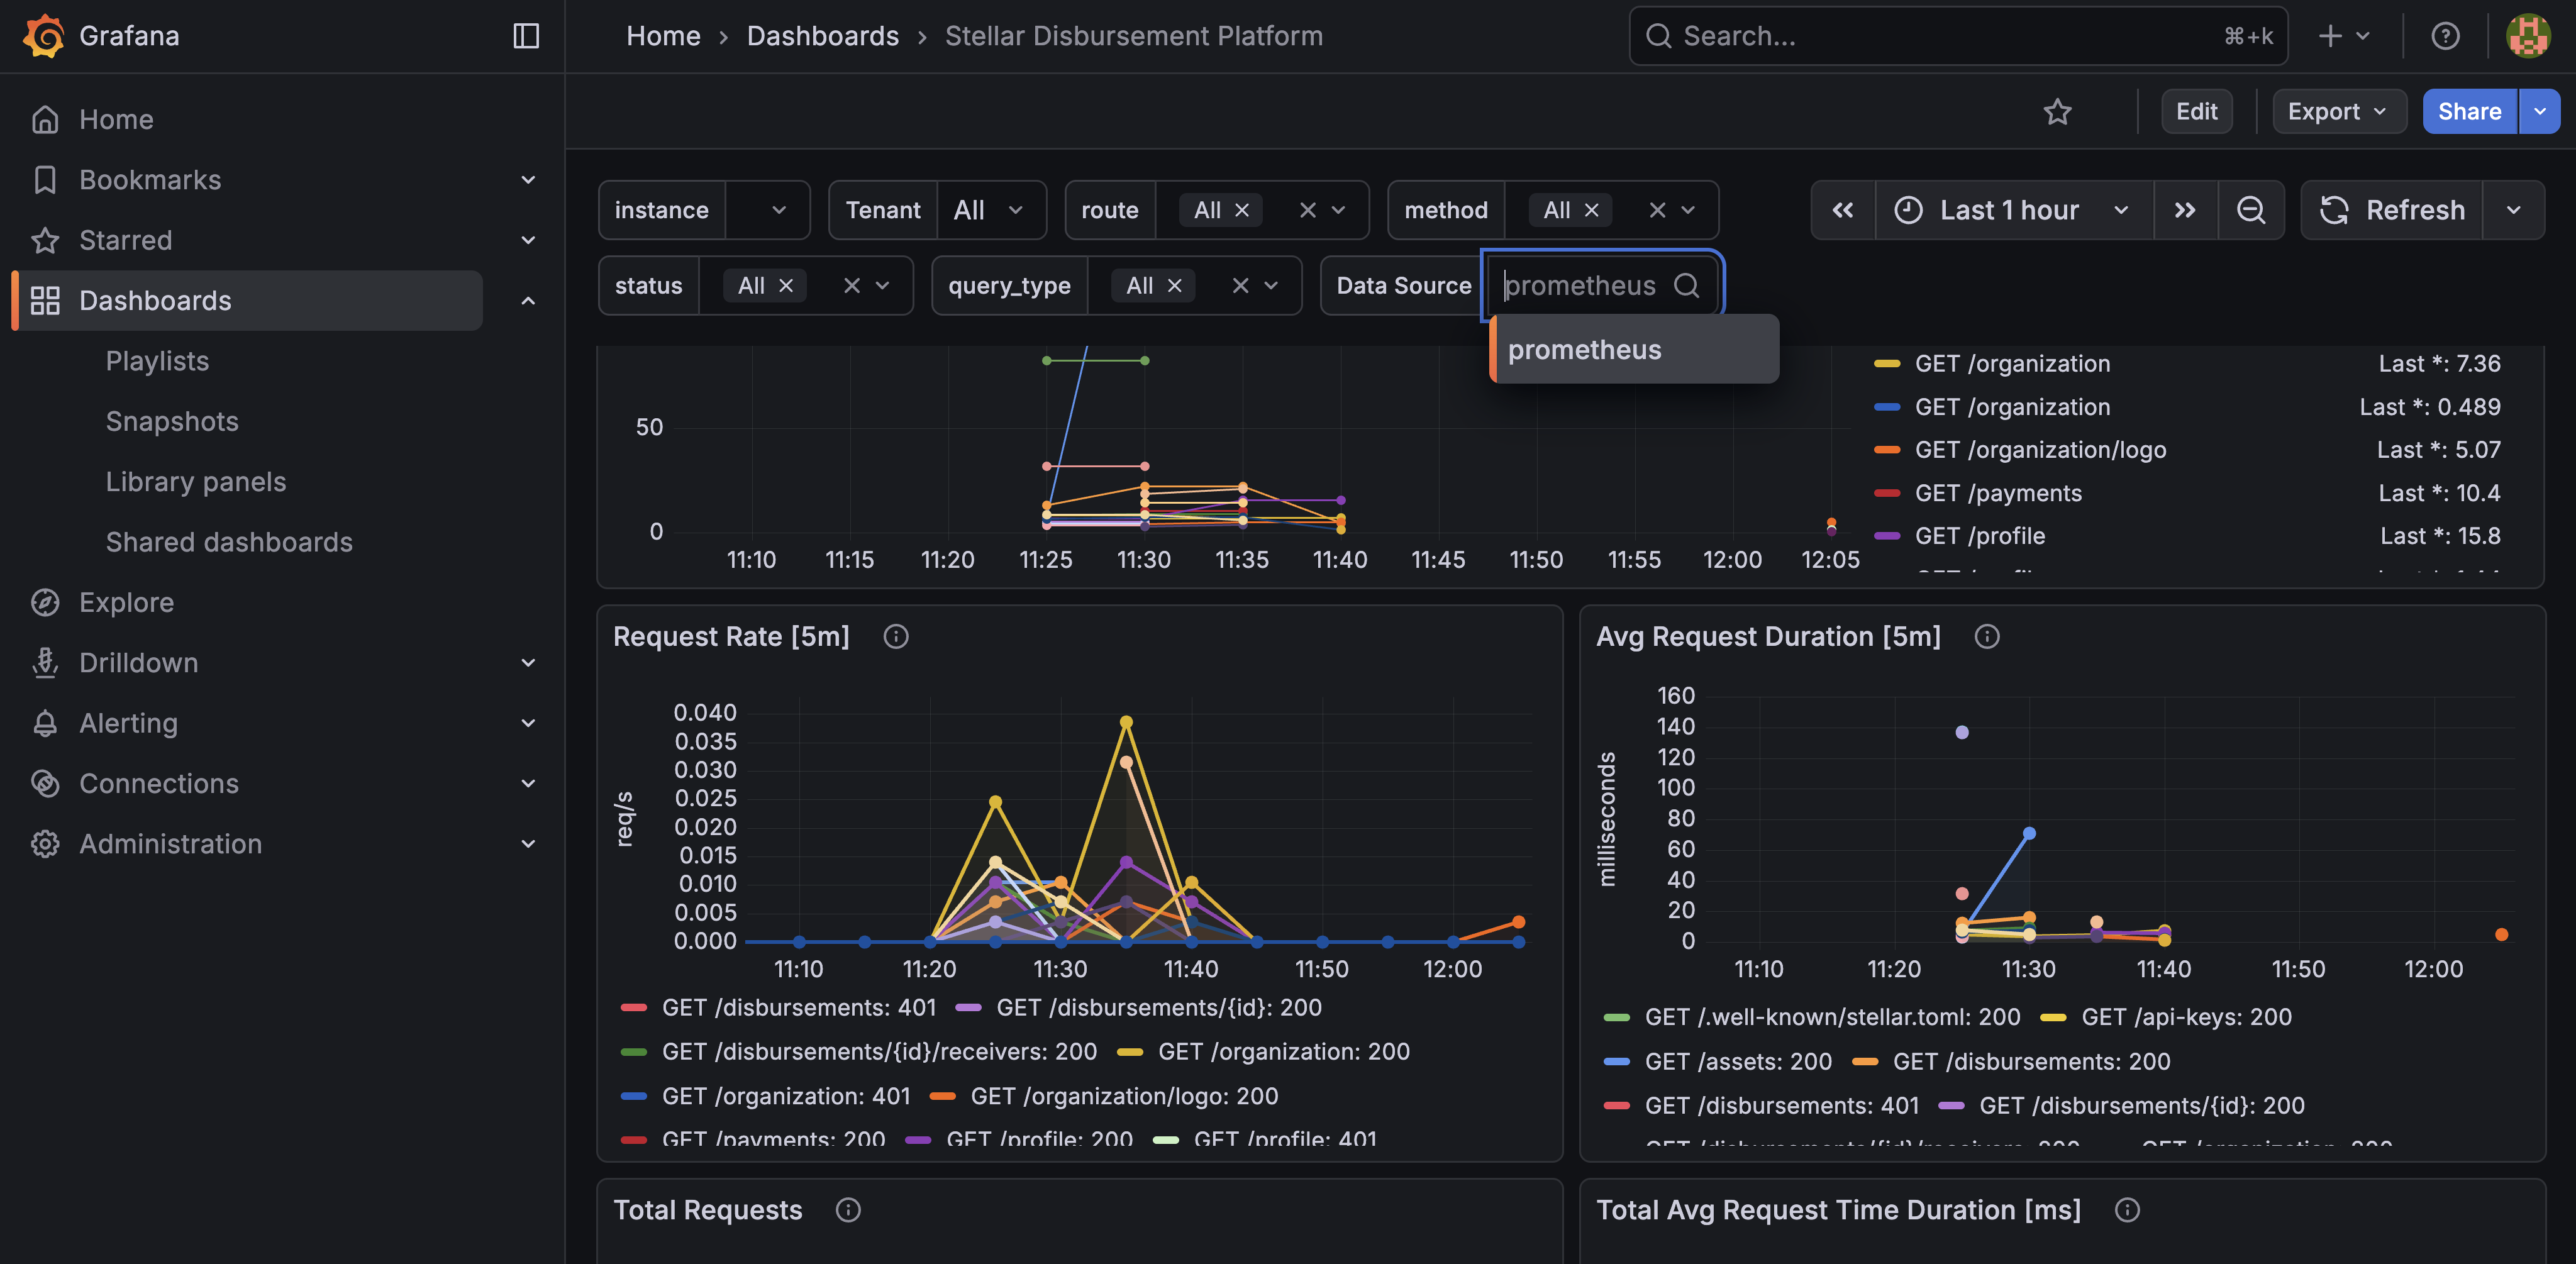
Three dashboards ship in resources/grafana: Stellar Disbursement Platform (dashboard.json), Transaction Submission Service Metrics (transaction_submission_service_dashboard.json), and TSS Payments Dashboard (tss_payments_dashboard.json). Import each the same way.
The main dashboard visualizes HTTP request volume/latency, database query timings, and TSS transaction statistics, details described in Grafana README.md. All panels can be filtered by method, route, tenant, or instance so you can distinguish traffic between multiple deployments.
Kubernetes and Helm
The Helm chart publishes both metrics ports and adds three switches, all off by default:
| Value | Turn it on when |
|---|---|
serviceMonitor.enabled | You run the Prometheus Operator. Needs the monitoring.coreos.com/v1 CRDs, plus serviceMonitor.additionalLabels set to whatever label your Operator discovers on, commonly release: kube-prometheus-stack. |
metricsScrapeAnnotations.enabled | Your Prometheus finds targets by pod annotation. Adds prometheus.io/scrape, prometheus.io/port and prometheus.io/path to both pods. |
grafanaDashboards.enabled | Your Grafana runs the kube-prometheus-stack sidecar. It imports the dashboards for you, so the manual steps above are not needed. |
Use serviceMonitor or metricsScrapeAnnotations, not both. The ports themselves come from sdp.configMap.data.METRICS_PORT and tss.configMap.data.TSS_METRICS_PORT.